Observability and Telemetry
Observability in a piece of software is anything that aids in understanding “what is this program doing”. This can include logs, metrics on timing, endpoint call count, etc.
The Caliper SDK has several built in observability layers.
Note
We do not currenly have a way for external developers to pull their own telemetry stats.
Logging
Logging is talked about in detail in several other places throughout the documentation. These logs are viewable when running locally streaming directly to your terminal, then via Q2Developer.com Self Service for external or Caliper Deployment Manager (CDM) for internal Q2 developers.
- Access for local dev:
Streams directly to your terminal
Can be configured via log levels (ex.
q2 run -l DEBUG)Can be redirected to a file (ex.
q2 run | tee out.log)
- Access in datacenter:
- Q2 developers
Caliper Deployment Manager (CDM) (internal devs)
Alexandria (internal devs)
- External developers
Q2Developer.com Self Service
OpenTelemetry
OpenTelemetry was added in SDK version 2.151.0 as a one size fits most observability solution. We really like its simultaneous ability to capture granular tracing information at a function level while also giving aggregated metrics to drill down through. OpenTelemetry is a spec rather than a product and is often visualized by another interface such as Jaeger or Splunk. Assuming you have docker installed on your machine, here’s a convenient command to boot up a local collector:
$ docker run -d --rm --name jaeger \
        -e COLLECTOR_ZIPKIN_HOST_PORT=:9411 \
        -e COLLECTOR_OTLP_ENABLED=true \
        -p 6831:6831/udp \
        -p 6832:6832/udp \
        -p 5778:5778 \
        -p 16686:16686 \
        -p 4317:4317 \
        -p 4318:4318 \
        -p 14250:14250 \
        -p 14268:14268 \
        -p 14269:14269 \
        -p 9411:9411 \
        jaegertracing/all-in-one:1.36 > /dev/null
With that done, you can enable this in your local SDK service with the Q2SDK_ENABLE_OPEN_TELEMETRY=True environment variable:
$ Q2SDK_ENABLE_OPEN_TELEMETRY=True q2 run
This will give you logs with this line in it:
OpenTelemetry Enabled: True
By default, the SDK keeps track of:
- Handler Metrics:
Duration
HTTP method
Extension name
Response StatusCode
Request ID
- Q2 Requests Network Calls
Duration
Headers
HTTP Method
Response StatusCode
URL called
- HQ Calls
Duration
Endpoint
Module (Q2Api/WedgeOnlineBanking)
HQ Url
Args
- Vault
Duration
Errors
Path requested
- SDK Metadata
Version
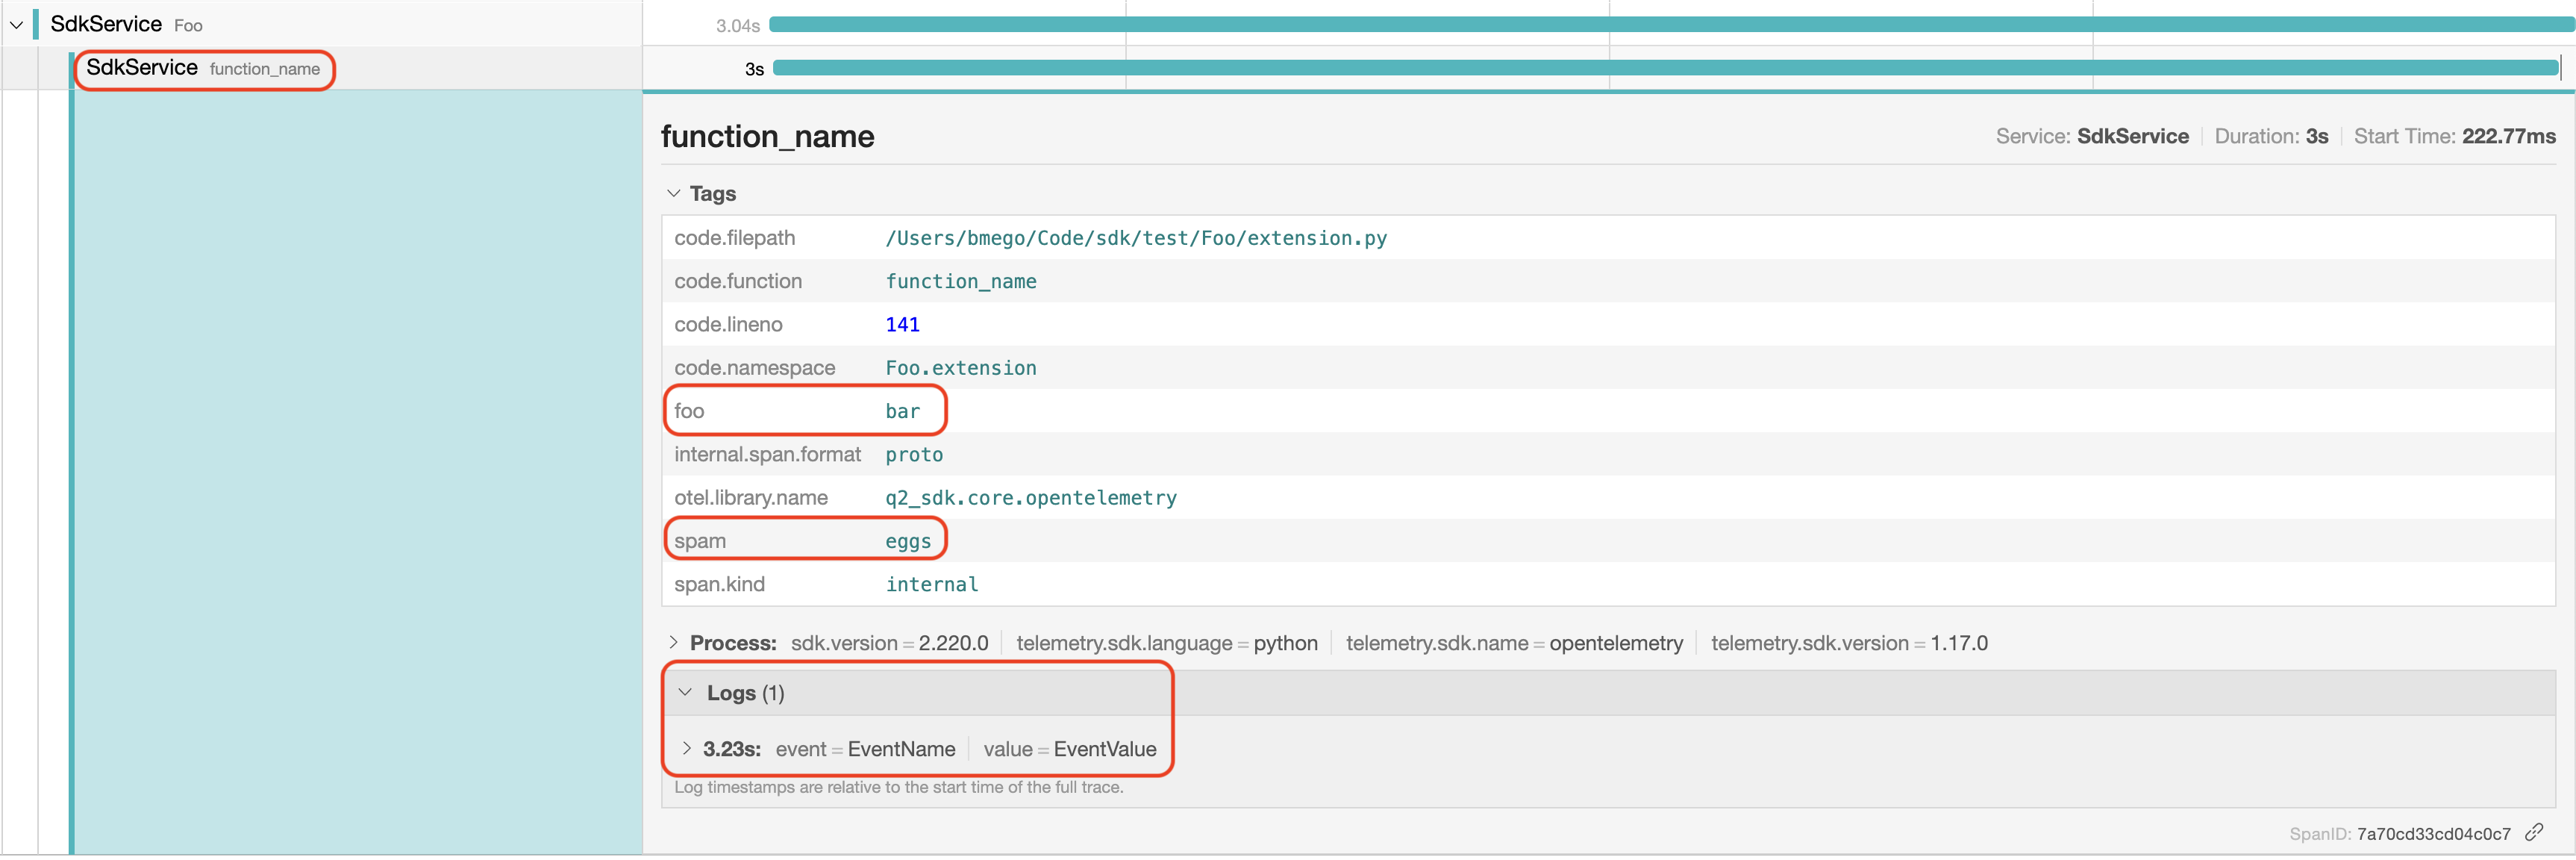
Adding your own spans is possible:
from q2_sdk.core.opentelemetry.span import Q2Span

@Q2Span.instrument()
def function_name(param_name):
    #do work
This will add a span called function_name that will attach itself to the appropriate location in the request hierarchy. Timing and param_name tracking is handled automatically.
To customize further, such as overriding your name, hiding a parameter from tags, or changing the SpanKind in case OpenTelemetry requires it for metric dashboarding:
from q2_sdk.core.opentelemetry.span import Q2Span, SpanKind

@Q2Span.instrument(name="custom_span_name" skip=['secret_param'], kind=SpanKind.SERVER)
def function_name(param_name, secret_param):
    #do work
Want to add attributes (fields) to your spans? No problem! There’s a helper for that:
from q2_sdk.core.opentelemetry.span import Q2Span

@Q2Span.instrument()
def function_name():
    Q2Span.set_attribute('spam', 'eggs')  # One attribute
    Q2Span.set_attributes(
        {
            'spam': 'eggs',
            'foo': 'bar',
        }
    )  # Multiple attributes
Or log an event on your span?:
from q2_sdk.core.opentelemetry.span import Q2Span

@Q2Span.instrument()
def function_name():
    Q2Span.add_event("EventName", {"value": "EventValue"})
How about marking a specific span as an Error?:
from q2_sdk.core.opentelemetry.span import Q2Span

@Q2Span.instrument()
def function_name():
    Q2Span.set_error(description="Something pretty bad happened")
In all these cases, Q2Span will work in the context of the existing span it was called from. No need to do fancy passing along of state!
If we implement all these in an extension, we get an output that looks like the following:
Report OTEL Errors
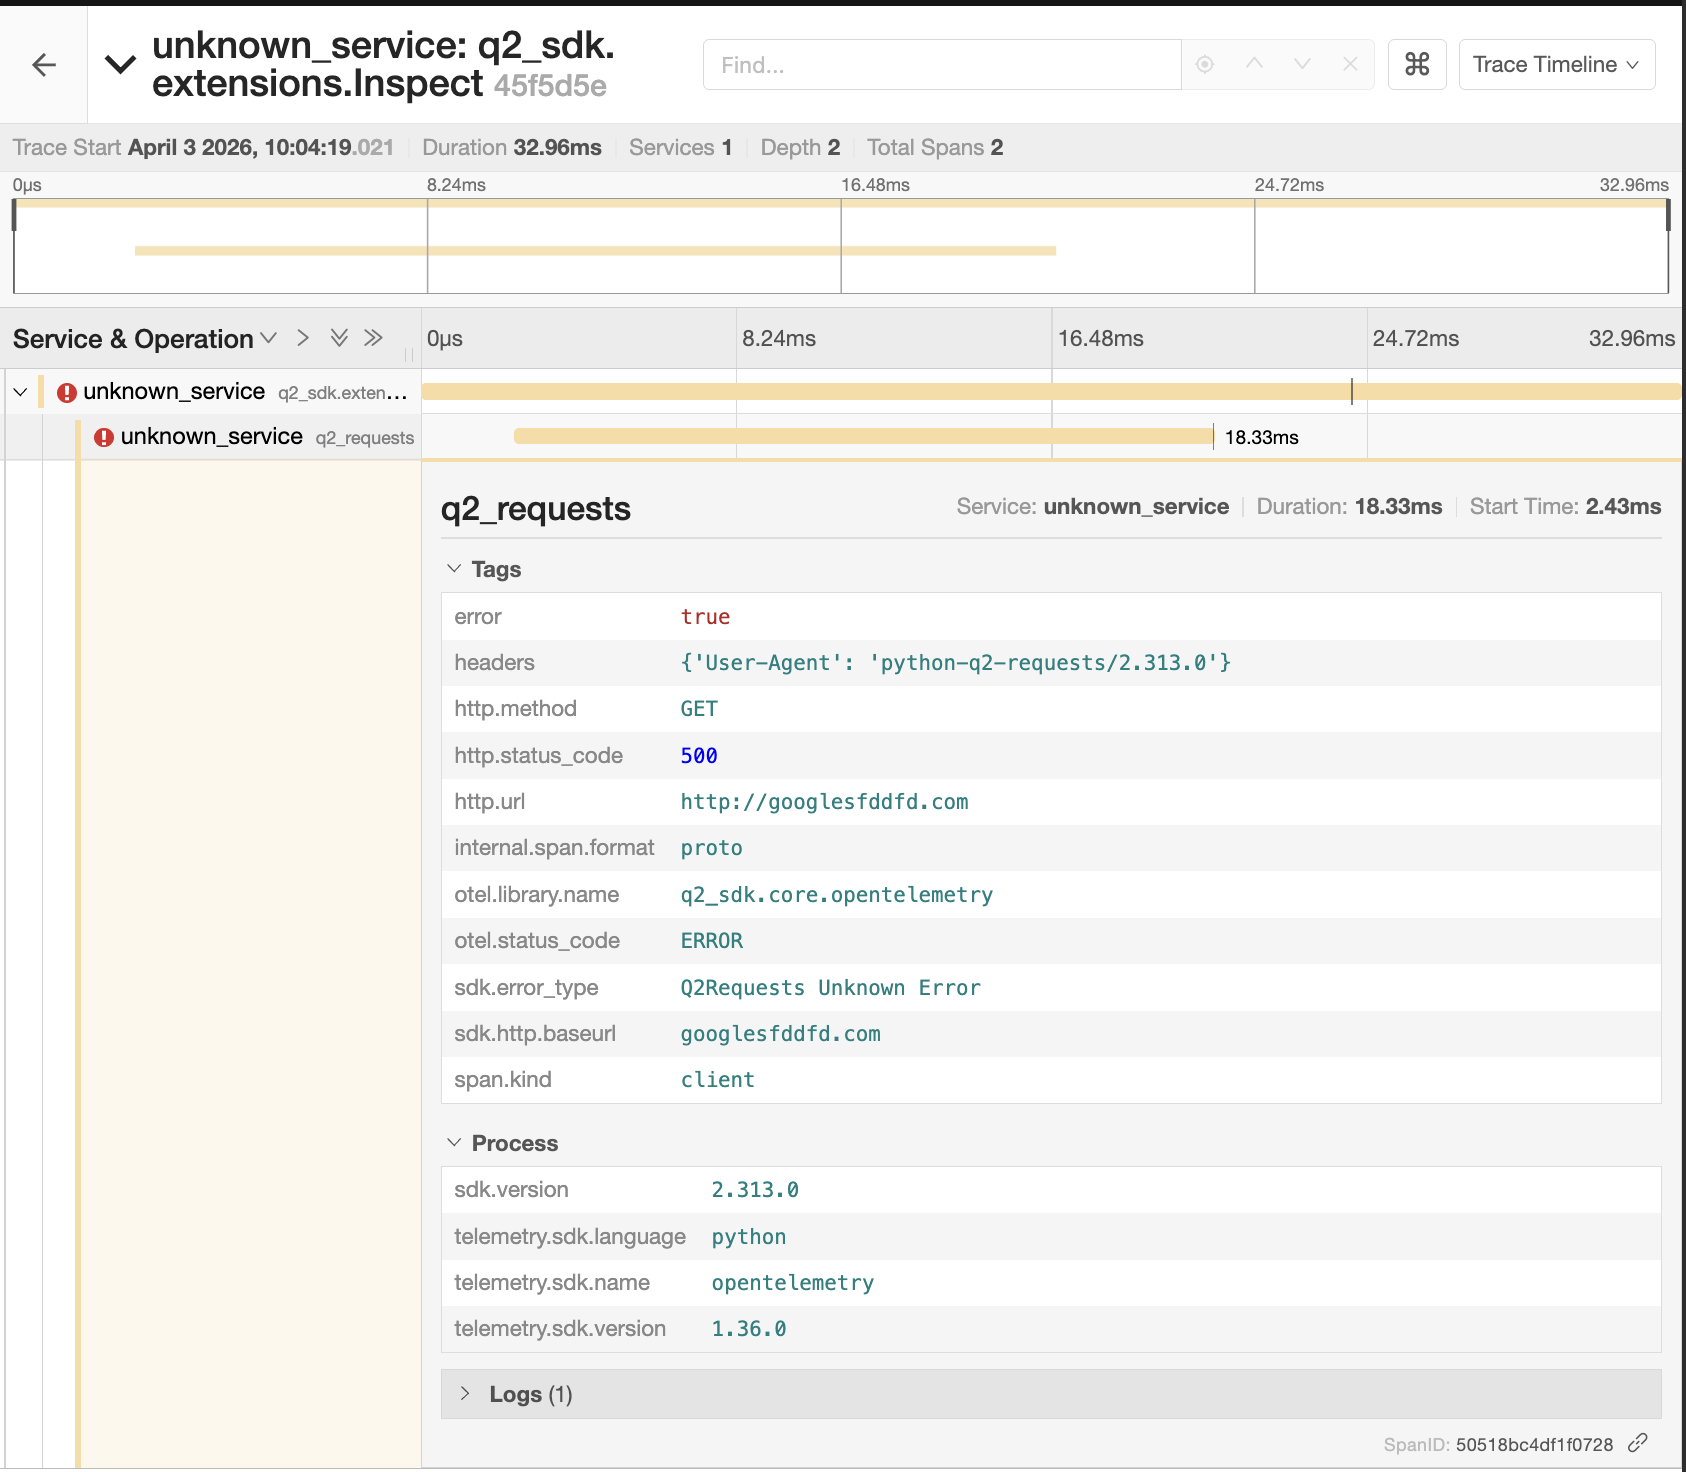
Assume that you have you have a use case where you do not want to report a non 200 error to OpenTelemetry.
You can do that by setting the report_otel_errors parameter to False in your q2_requests call.
This will prevent the SDK from automatically marking the span as an error in OpenTelemetry when a non 200 response is received.
For example:
q2_requests.get(self.logger, "http://googlesfddfd.com", verify_whitelist=False,
report_otel_errors=False)
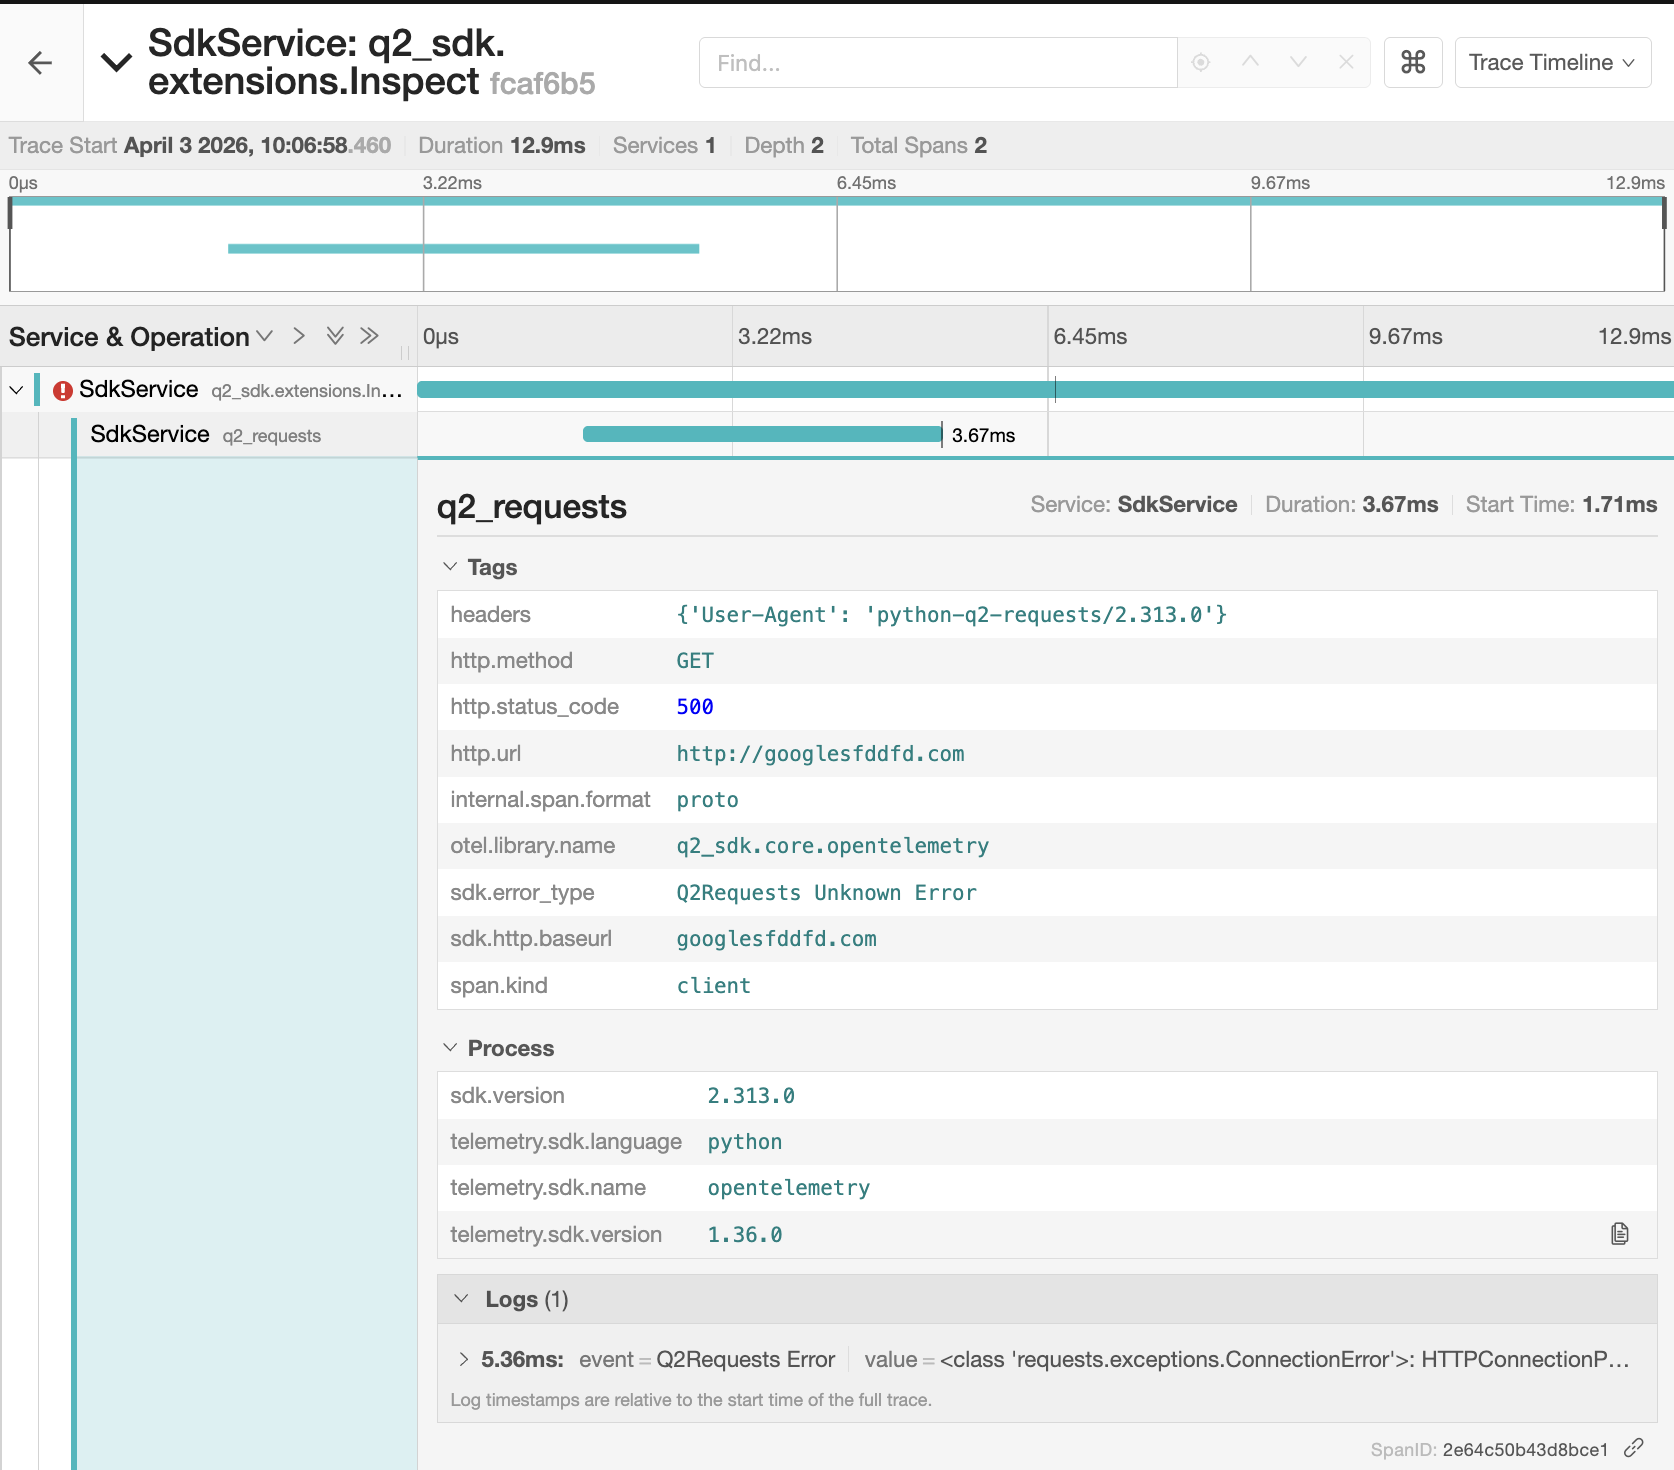
q2_requests.get(self.logger, "http://googlesfddfd.com", verify_whitelist=False,
report_otel_errors=True)
Prometheus
Prometheus provides aggregated data about how many times endpoints were called, average response time, etc. If you’ve noticed the builtin /metrics endpoint in your running SDK extension, that’s the exposed data that the Prometheus tool internally here at Q2 polls on a regular basis.
By default, the SDK keeps track of:
- Handler Metrics:
Histogram of call Durations
HTTP method
Extension name
Response StatusCode
- Q2 Requests Network Calls
Histogram of call Durations
HTTP Method
URL called
- HQ Calls
Histogram of call Durations
Endpoint Name
Module (Q2Api/WedgeOnlineBanking)
HQ Url
- Cache
Request type (get/set/delete)
Histogram of call Durations
- SDK Metadata
Failed forked process count
Requests in progress
We generally prefer the use of OpenTelemetry for this type of data these days, but nevertheless it is possible to add your own prometheus metrics:
from q2_sdk.core.prometheus import MetricType, get_metric

prometheus.get_metric(
    MetricType.Counter,
    'caliper_endpoints',
    'Number of times called',
    labels={'endpoint': self.extension_name}
).inc()